Configuring Multi-Graph Runner
To configure an MGR instance, the combination of the different algorithms needs to be specified.
MGR can be configured with a dataflow graph. The MGR dataflow is a directed bipartite graph consisting of data nodes and process nodes.
This model is very similar to the UVAP dataflow. However, MGR deals with high-bitrate uncompressed video streams. This data cannot be transferred over Kafka because of the I/O and network limitations. MGR deals with low-level image processing algorithms while the rest of the microservices deal with higher level lightweight data.
Another significant difference is that the MGR dataflow is synchronized.
Meaning, all the processing nodes (within one data_run, see later) are called
exactly once for each input frame in dependency order.
Environment Variables
MGR_PROPERTY_FILE_PATHS: property file list
MGR reads its configuration from the property files in the above list during startup. See the list of properties below.
Changing the Configuration
It is possible to modify the configuration while MGR is running. When you modify
the configuration files on disk, MGR will not automatically reload them. Instead,
this can be achieved by posting a HTTP reload request through the monitoring port
of the MGR service. (The monitoring port is given in the MGR property file,
e.g. the MGR base template property file.) For example:
$ curl -X POST http://localhost:6497/reload
will reload the configuration files. Reloading modified configuration is "smart",
i.e. only those streams will be affected for which the configuration has changed.
The reload request may return with the error code 500 in case it fails
(e.g. because of invalid configuration), and the streams that could not be restarted
will be stopped.
Properties
For an example of the MGR properties, see the MGR base template property file.
| Property | Description | Default Value |
|---|---|---|
ultinous.service.mgr.log.level | Log level | debug |
ultinous.service.mgr.monitoring.port | Monitoring port | (required) |
ultinous.service.mgr.monitoring.threads | Monitoring server thread pool size | 1 |
ultinous.service.mgr.gpu.device.id | GPU device ID to use | 0 |
ultinous.service.mgr.cache.dir | Cache directory for analysis files | ~/.cache/multi-graph-runner |
ultinous.service.mgr.use.gstreamer | Use GStreamer for H264 decoding (instead of ffmpeg). This will enable using GPU for video decoding where possible. | false |
ultinous.service.mgr.export.dir | Data Flow Graph export directory | . |
ultinous.service.mgr.export.interval.mins | DataFlowGraph export interval in minutes | 60 |
ultinous.service.mgr.licensing.text.file | Licensing text file | (required) |
ultinous.service.mgr.licensing.key.file | Licensing key file | (required) |
ultinous.service.mgr.licensing.check.period.secs | Licence check period in seconds (max 1 hour) | 3600 (=1h) |
ultinous.service.mgr.data.flow.file | Configuration file (see below) | (required) |
Configuration File Format
The dataflow configuration is a text file following the prototext
(.prototxt) format. It is a simple structured format that can be best understood
from the example below. Formal definition of the configuration file is
given in the UVAP MGR configuration format proto file, which also
contains the documentation for the configuration of individual features
provided by MGR.
Note:
.protoand.prototxtare two different formats..prototxtis used to configure MGR while.protois used to formally define the possible configuration options. For more information on these formats, see Protocol Buffers.
The following is an example of a specified Region of Interest (ROI) cropping
process node in configuration part (.prototxt):
...
# comment is hash mark in prototxt
process_node {
  type: ROI
  name: "roi1"
  roi_config {
    input: "input"
    output: "roi1"
    x: 400
    y: 200
    width: 400
    height: 400
  }
}
...
The following example is the corresponding parts of the formal .proto
definition (... is used to substitute for omitted parts):
message DataFlowGraphConfig {
  ...
  repeated ProcessNodeConfig process_node = 3; // the process nodes
  ...
}

...
message ProcessNodeConfig {
  enum Type {
    ...
    ROI = 2;
    ...
  }

  required Type type = 1;
  required string name = 2;
  ...
  optional ROIConfig roi_config = 6;
  ...
}
...
message ROIConfig {
  required string output = 2; // output FRAME

  required int32 x = 3; // x coordinate of the top left corner in pixels
  required int32 y = 4; // y coordinate of the top left corner in pixels
  required int32 width = 5; // in pixels
  required int32 height = 6; // in pixels
}
...
Environment Configuration
environment:
{
  debug_level: 4
  profile: true
  gui: NORMAL
  drop_off: {}    # do not drop frames, instead queue them up
  #drop_on: {}    # if the system gets overloaded drop frames
  kafka_broker_list: "localhost:9092"
  no_input_policy: RUN_IF_DROP_ON
  backend: TENSORRT_FP16
}
The following table describes the environment configuration parameters:
| Parameter | Description |
|---|---|
debug_level | Optional. Specifies the logging level. Values: 0: fatal; 1: error; 2: warning; 3: info; 4: debug; 5: trace. Default value is 2. |
profile | Optional. If set to true then statistics are printed periodically and at shutdown to the standard output. Default value is false. |
analysis_hangup_timeout_ms | Optional. Timeout for single tasks in milliseconds. Issues a warning when exceeded, an error when the double value is exceeded. Aborts the whole program when the set value is exceeded by 4 times unless abort_on_long_hangup (see below) is set to false. 0 means there is no timeout for individual tasks. Default value is 4000. |
abort_on_long_hangup | Optional. See the analysis_hangup_timeout_ms descrition above. Default value is true. |
drop_off | Frame dropping is off. Use this parameter to batch process video files not in real time when timing is not important. Provide an empty structure for the default DropOffMode settings. |
drop_on | Frame dropping is on. Use this parameter to process video streams in real time. If a frame is older than a given amount of time then it is dropped instead of processed. Provide an empty structure for the default DropOnMode settings. |
kafka_broker_list | Optional. String specifying the Kafka host address. |
kafka_topic_prefix | Optional. String specifying the Kafka topic prefix. |
kafka_sasl_username | Optional. String specifying the Kafka SASL username. When this parameter is set it enables SASL authentication. |
kafka_sasl_password | Optional. String specifying the Kafka SASL password. |
backend | Optional. Default CAFFE. Other options are TENSORRT_FP32 and TENSORRT_FP16. See below. |
no_input_policy | Optional. Defines the behaviour in case the inputs become empty. Values: RUN, STOP, RUN_IF_DROP_ON. Default is RUN_IF_DROP_ON. |
Backend
CAFFE: Caffe backend. Legacy. Fair speed. This is the default of the program.TENSORRT_FP32: TensorRT backend. Same precision as Caffe, but 2 times faster according to our measurements.TENSORRT_FP16: TensorRT backend with half precision floating point numbers. Results are a few percent worse, but the speed is 4 times better than Caffe (2 times better than TensorRT FP32) according to our measurements. This option is available on GTX 16xx, from RTX 20xx, on all cards with Turing architect and on Jetson machines. If not available then the system will fall back to TensorRT FP32. This is the recommended option, especially on smaller machines like Jetson TX2. This is what is shipped in the sample configuration files.
Below is a full example of a dataflow configuration file. This simply reads the webcam stream, runs head detector on every second frame then writes the detection results to a Kafka stream. The following graph is annotated with comments embedded for better understanding:
# load the necessary engines (set of models that will be used)
engines_file: "/opt/ultinous/models/engines/head_det.prototxt"

environment:
{
  debug_level: 4
  profile: false
  gui: NONE                 # can be set to NORMAL for debug purposes
  drop_on: {}               # drop frames if the processing cannot keep up with real-time
  kafka_broker_list: "localhost:9092"
  no_input_policy: RUN_IF_DROP_ON
  backend: TENSORRT_FP16
}

# a data run for the webcam stream (there can be multiple data runs)
data_run:
{
  input:
  {
    file_name: "/dev/video0"  # input is device 0, typically the webcam
    keep_rate: 3   # process only every third frame
    frame_period_ms: 40 # required the 25 FPS of input stream, if it is bigger the MGR gives WARNING
  }

  data_flow:
  {
    data_node: {type: FRAME name: "input"}      # always have to have the input frame
    data_node: {type: DETECTIONS name: "detections"}

    # the head detector
    process_node:
    {
      type: OBJ_DETECTOR
      name: "head_detector"
      logging: false
      obj_det_config:
      {
        type: HEAD
        input: "input"              # connect to the input data node
        bounding_boxes: "detections"
        min_height_in_pixels: 16
        max_height_in_pixels: 256
        confidence_threshold: 0.95  # look for high confidence detections
        image_scale_factor: 0.5     # downscale image by a factor of 2
      }
    }

    # write detections to a Kafka stream
    process_node:
    {
      type: KAFKA_OUTPUT
      name: "kafka_output_detections"
      kafka_output_config:
      {
        topic_name: "demo.cam.0.dets.ObjectDetectionRecord.json"
        input_node: "detections"    # connect to the detections data node
      }
    }
  }
}
Process nodes are connected through data nodes. The following graph visualizes the dataflow:
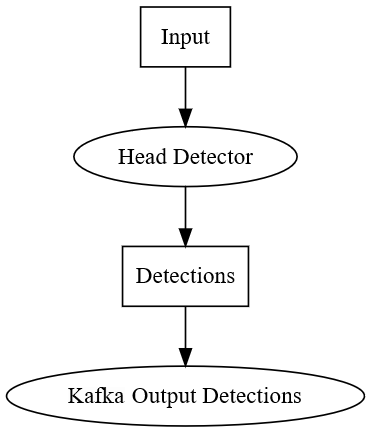 Example Dataflow
Rectangles are data nodes and ellipses are process nodes.
Example Dataflow
Rectangles are data nodes and ellipses are process nodes.
The data_flow section describes the dataflow itself. First, list all data
nodes then list all process nodes. Process nodes are executed in the order of
the listing. Process nodes refer to the input and output data nodes in their
configuration.
For configurations options in more detail, see the UVAP MGR configuration format proto file. Comments are embedded for explanation.
The example full.prototxt is a more complex dataflow, involving two cameras and most
of the deep learning models.
Further reading: Operating Multi-Graph Runner
Feature Demo
MGR is used for basic detections in all Feature Demos.