Events
Events are incident notifications triggered by your solutions. A visualised output of your Counters can also be found here, see below for details.
Before you start
Once every Camera is registered and Solutions are created in Ultinous AI Suite (with or without a Schedule), everything is set for receiving Events.
Event notifications
Ultinous AI Suite
If Ultinous AI Suite is opened in your browser, you can see the following indications of a newly triggered Event:
A notification badge will be displayed on the Events button at the left-side panel: it shows you the number of new detections since you last activated it. Clicking on it will take you to the list of recorded detections.
A notification bar appears at the bottom centre of any page. The bar will not disappear until it is closed manually or the incident is investigated by clicking on the More link on it.
A Beeping sound is played (unless the browser tab is muted).
You can mute / unmute a browser tab by right-clicking on the tab and selecting the appropriate function.
New detection Events are recorded in the Events view.
Integrated third-party software
Ultinous AI Suite Events can be sent to a third-party software where user notifications are defined by the respective software's custom implementation. Please contact the software provider to learn more about third-party notifications.
Events view
Past or recently reported incidents can be managed in the Events view.
Click the Events menu on the left sidebar for this view.
Event Replay
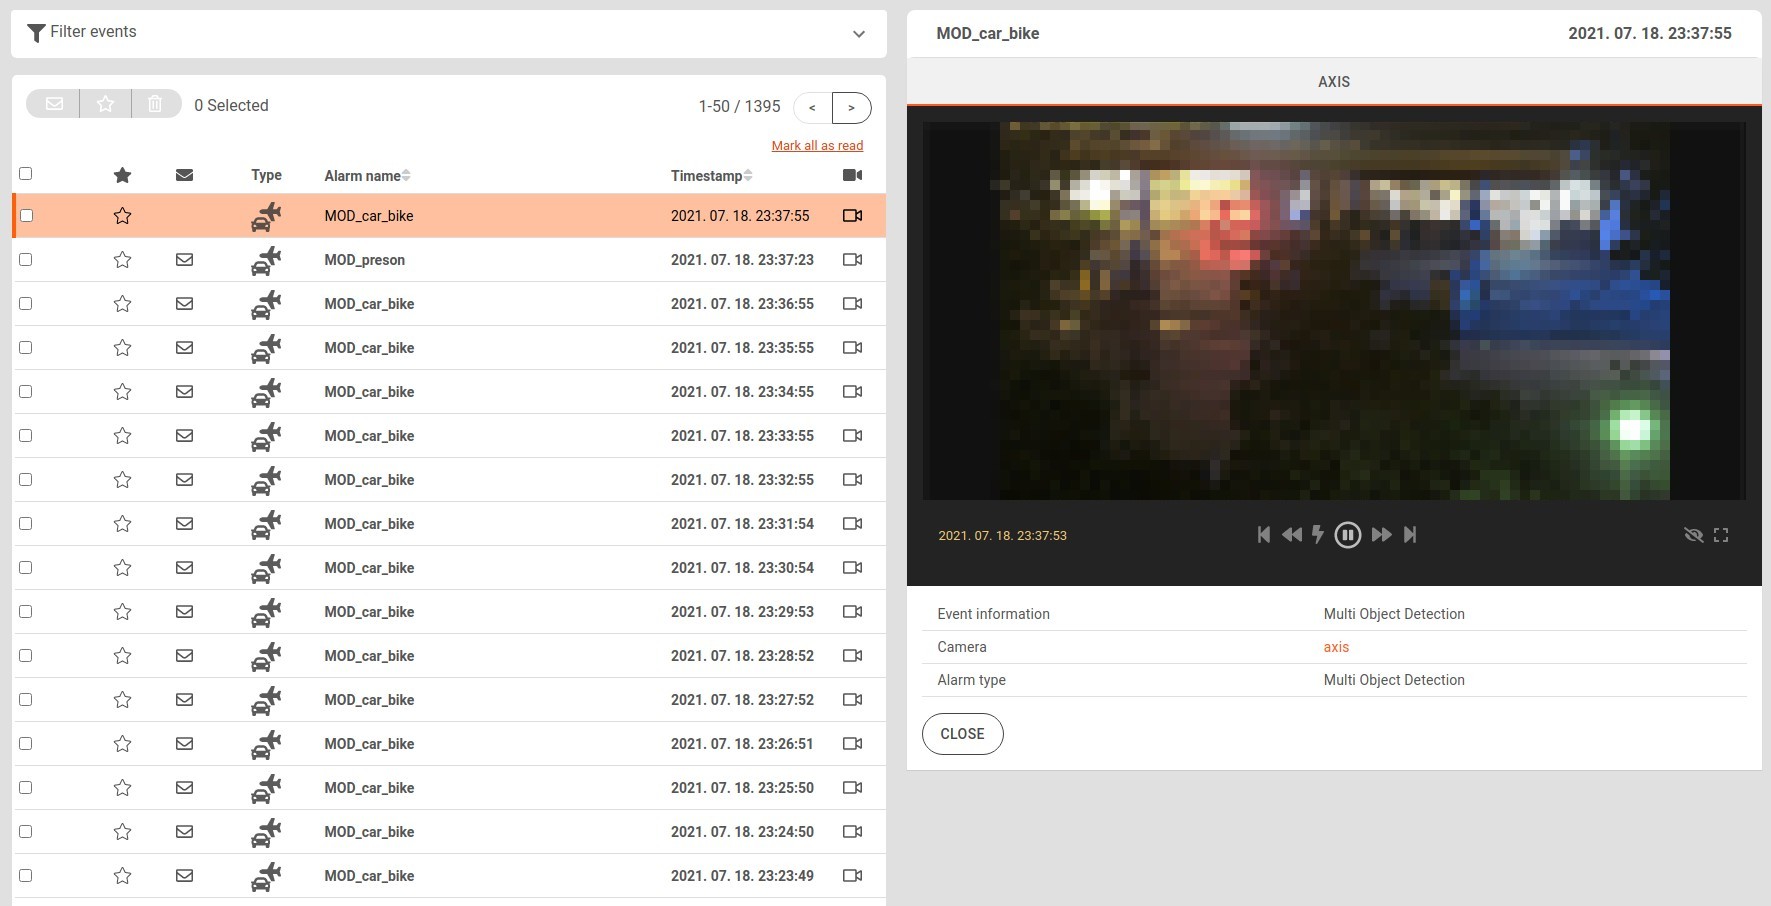
Triggered Events are listed in reversed time order by default. This can be changed by clicking on the respective column's header. The Alarm which triggered the event can be recognised by its name.
Click on a row in the table to replay the incident. The replay starts from a few seconds before the Event's timestamp.
The playback availability is denoted by the Camera icon on right side of the Event's row. If the icon is missing, the playback of that Event is still loading.
Display features
If a ROI is associated with a Solution, the ROI is displayed as a green polygon. Negative ROI are displayed as white polygons.
Zone Trespassing uses different types of ROI: 'Source' ROI are displayed as yellow, 'Target' ROI as red and 'Exclude' ROI as white polygons.
Detections are displayed as orange / aqua rectangles for people / vehicles, respectively.
At the triggering moment, a Bell icon will appear in the top right corner of the player.
The timestamp of the video is at the bottom left of the player (can be different from the one that comes from the camera) in the time zone of the device. The time zone can be modified in the Control Panel.
Note: If multiple cameras are linked to the triggering Alarm, there might be no activity in the record of some of these cameras. In this case, the Event was triggered by the activity of different cameras.
Controls
||and>toggles between pause and playFlashbutton jumps to the triggering moment and pauses the player|<button rewinds to a few seconds before the Event>|button switches to live play<<button jumps backward ten seconds>>button jumps forward ten seconds- The Eye button shows / hides annotations
- You can go to full screen play with the Rectangle button in the lower right corner of the player
Filter Events
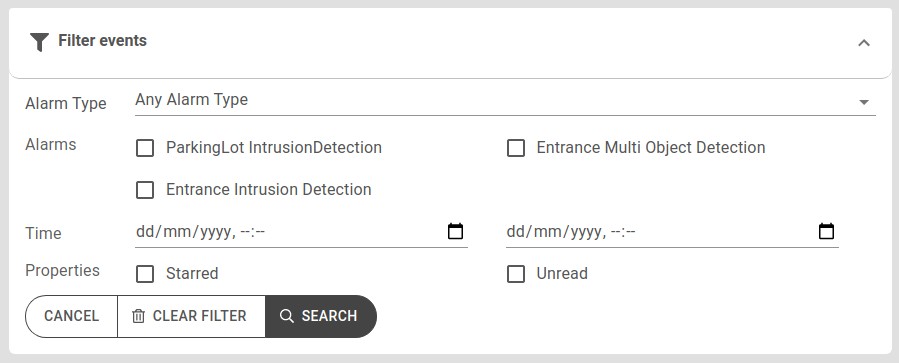
You can filter what type of Events to display by clicking on the Filter events drop-down menu and ticking the respective checkbox. You can filter Events by:
- Detection type (Intrusion-, Multi Object- and Crowd Detection or 'Any' alarm type)
- Solutions, set up by the user, as described in Solutions
- The time frame the detections were triggered within
- Starred or Unread status
Note: You can also identify an Event's detection type by its icon in the Event list.
You can select and mark specific or all displayed Events as Starred, toggle their Read/Unread status, or delete them.

Tick the checkboxes of the respective Events, or tick the checkbox at the top left corner of the Event list to select or deselect all currently displayed Events. You may change their status by clicking the three orange icons (shown above). Alternatively, to mark an Event as Starred or toggle their Read/Unread status, click the corresponding icon on the Event's row.
Counters
Counters are designed with third-party solutions in mind, however, their output can be accessed within Ultinous AI Suite as well, in the Events screen.
Before you start
Once every Camera is registered and Counters are created in the Solutions screen, everything is set for viewing their output here.
- Click the Events/Data button at the top right corner of the Events screen.

- Select the counter from the drop-down list on the upper left corner of the Events screen.

Multi Object Counter
Recent data

The rectangle(s) show you the last, median and maximum number of detections that occurred in the last aggregation interval, of each object type associated with the Counter. They are a good way to read the Counter's data at a glance.
Counter chart and table

Consulting the line chart gives you a bird's eye view of the observed area's detection trends for the last 200 observations.
Below, a table view is also available, showing the following data in an object-by-object basis: the first and last detections, as well as the median, average, minimum and maximum number of detections within each aggregation interval.
Aggregation frequency
The aggregation frequency for the Counter determines the time interval between each counting. It is 5 seconds by default, and can be adjusted in the [Solutions screen]. This setting applies to all three views as well as to the downloadable .csv file.
Note: The last 200 detections will be shown at all times, regardless of the time interval set between them - which means the time covered by the Recent data, chart and table can range from a few minutes to several hours, depending on the interval set.
You can download the Counter's data is .csv format, by clicking the Download as csv button in the top right of the chart. You can set a time interval here, for up to three days.
Traffic Counting
Recent data
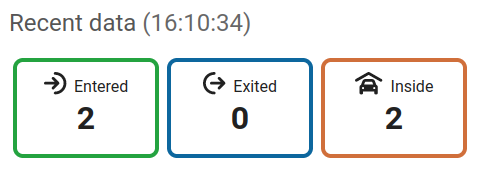
The rectangle(s) show you the number of entered, exited detections as well as those of remaining inside of the area specified, that occurred in the last aggregation interval, of each object type associated with the Traffic Counting. They are a good way to read its data at a glance.
For a more detailed view, Traffic Counting is designed with integration in mind - either by utilising the Google BigQuery solution or by the custom Traffic Counting API.
Output Streams
Output streams are designed with third-party integration in mind, however their output can be accessed within Ultinous AI Suite as well, in the Events screen.
Before you start
Once every Camera is registered and Output Streams are created and configured in the Solutions screen, everything is set for viewing their output here.
Click the Events/Data button at the top right corner of the Events screen.

Select the output stream from the drop-down list on the upper left corner of the Events screen.
Metadata Output

The data produced by Metadata Output is designed to be used in third-party integrations via API. It is also downloadable directly, in .csv format, by clicking the Download as csv button. You can set a time interval here, for up to one hour.
Event & video retention
AI Suite is able to store event data (containing the videos attached to the events) up to the point where the space allocated for it has filled up. The amount of space reserved for event data depends on the number of cameras registered: each time a camera is added, the storage space is divided by the number of cameras, continuously shrinking the allocated space so that each camera always has equal space reserved. Once this limit is reached, the oldest videos will be deleted to free up space for new events.
Event entries under the Events view get deleted two days after the corresponding video has been deleted.
It is recommended to store event data via a third-party integration or service, such as Google BigQuery, Milestone XProtect, etc.
Troubleshooting
- I am not receiving any events from my Solutions.
- Check your Solution settings and try changing the Sensitivity of the detector to Medium or High.
- I am receiving false detections from my Solutions.
- Check your Solution settings and try lowering the Sensitivity of the detector. You may also draw Regions of Interest to exclude areas/only include certain ones to run the detections on. Additionally, you may set a custom object size to limit the detections to objects of certain size range.